South Africa
36.6 GW of commercial solar potential. 29 GW still untapped.
Across 224,000 commercial and industrial rooftops, South Africa is the continent's most advanced C&I solar market — and at 8.4% national adoption, most of the opportunity is still ahead.
South Africa is the most load-bearing case for C&I solar on the continent. Loadshedding made the commercial case before the policy framework did — operators didn't wait for incentives; they installed because the grid couldn't be relied on. That structural driver, combined with some of the best commercial irradiance in the world, has produced a market with real adoption across every province, a developed EPC ecosystem, and a growing pipeline of corporates committed to on-site generation.
But 8.6% national adoption on 224,000 rooftops means the market is still early. The takeoff curve is straightening — the largest rooftops have moved decisively, the middle of the size range is where the momentum now sits, and the provinces farthest from the industrial core remain well below national average. The question isn't whether South Africa's C&I rooftop market will grow. It's which provinces will track the leaders and which are structurally constrained — and what the 29 GW of untapped capacity tells you about where to point outbound effort next.
The national picture
South Africa's national adoption curve is a clean takeoff shape. The bottom band — rooftops below 500 m² — sits near 3%. Each step up in size roughly doubles adoption, reaching 41% on the largest segment above 16,000 m². That steep rise from left to right is the early-market signature: the economics are strongest at the top, the big roofs went first, and the rest of the market is now following them up.
What's notable is where the curve has moved. The largest segment has pushed past 42% adoption, and the 4,000–16,000 m² band has crossed 28% — both well beyond the 25–30% threshold where broadening typically begins. The momentum has clearly shifted into the middle of the size range, where the 2,000–4,000 m² band sits at 18% and climbing fast. The smallest rooftops, near 3%, are still waiting — but the floor is no longer at zero.
The implication is that South Africa is firmly into its broadening phase at national level, but with enormous heterogeneity underneath. Gauteng and Western Cape are pulling ahead; KwaZulu-Natal, North West, and Limpopo are well behind. The national average masks a market that is actually several markets at different stages — with different windows, different densities, and different runway.
Regional breakdown
Western Cape
↑ topWestern Cape leads the country on adoption at 12.6%, on a rooftop base that has grown sharply to 36,437 — second only to Gauteng. The curve is the most mature in the country: the top segment has reached 55% adoption, and even the smallest band has lifted off the floor. The market is anchored by Cape Town's commercial and retail density, logistics around the port, and the strongest early-mover EPC base in the country. With 4.3 GW still untapped, it's far from depleted — but it's the most competed market, and the live opportunity has moved into the middle segments, which trail the top by 30 points or more.
Gauteng
↑ topGauteng is the engine. It carries 51,353 rooftops — 23% of the national base — and the largest untapped pool in the country at 8.2 GW. Adoption is 12.4%, just behind Western Cape, yet the absolute opportunity still dwarfs everywhere else. The largest rooftops sit at 42% adoption; the smallest remain near 4%. A dense, industrial-weighted footprint deep into its broadening phase, where the concentration of opportunity per square kilometre is the highest in the country and the mid-range segments are converting fastest.
Eastern Cape
↑ topEastern Cape has moved up to 8.3% adoption on a base that has expanded to 16,732 rooftops. The automotive and port-industrial cluster around Nelson Mandela Bay anchors the pipeline; elsewhere the province is sparser. With 2.2 GW untapped and a curve tracking just above the national shape, it's a solid mid-tier opportunity — real depth, the top segment already at 37%, but not a priority against the scale of Gauteng or KwaZulu-Natal. A steady-growth province for operators who have worked the larger pools.
Northern Cape
↑ topThe Northern Cape presents the density–irradiance inversion most sharply. This is where South Africa's irradiance peaks — among the highest in the world — but commercial density is very low. At 9,485 rooftops, it has the smallest industrial footprint of any province, and 0.7 GW of untapped capacity reflects that constraint. The 100% adoption on the largest segment (6 rooftops) is a statistical artefact of a tiny cohort, not a market signal. The Northern Cape will keep attracting large-scale ground-mounted projects; C&I rooftop development here follows commercial density, not the sun.
Free State
↑ topFree State is a mid-density, below-average-adoption province: 6.1% nationally, 16,331 rooftops, 1.95 GW untapped. Agriculture and agri-processing define the load profile — large rooftops with high daytime demand but concentrated in a dispersed provincial footprint. The curve is early-stage; even the top segment sits at only 30%. A real and underworked market, but one that requires more effort per deal than the urban-industrial provinces.
Mpumalanga
↑ topMpumalanga is a province of heavy industry — coal, power, and manufacturing — and its C&I rooftop base reflects that: 21,257 rooftops, weighted toward the large-industrial segment. At 5.6% adoption and 2.47 GW untapped, it's a below-average market on a large base. The irony is that Mpumalanga sits at the centre of South Africa's energy transition narrative, yet C&I rooftop adoption has lagged — partly because the large industrial operators there have historically had access to cheap grid power, and partly because the shift from diesel backup to solar-first thinking is still early. That's a timing gap, not a structural one.
KwaZulu-Natal
↑ topKwaZulu-Natal carries the second-largest untapped pool in the country at 4.9 GW, now on a rooftop base that has grown to 35,413 — the third-largest province. Adoption has climbed to 6.5%, but the curve is still early: the top segment sits at 32%, well below Western Cape's 50%. KZN combines a diversified commercial economy — port, manufacturing, retail, and the Durban logistics corridor — with adoption that hasn't yet absorbed the acceleration that pushed Gauteng and the Cape earlier. That gap is closing fast, and the untapped pool is large enough to sustain extended outbound focus. This is where the next concentrated wave is forming.
North West
↑ topNorth West is a mining-weighted province with 19,601 rooftops and 4.8% adoption. The 2.23 GW untapped represents real capacity, but the mining-dominated load profile means many of the largest industrial consumers have their own generation arrangements. The mid-range commercial segment — retail, agri-processing, light industrial — is the active opportunity. A below-average, below-density market relative to Gauteng, but with a longer tail of mid-sized rooftops that haven't been systematically worked.
Limpopo
↑ topLimpopo closes the ranking at 4.7% adoption across 18,219 rooftops. It shares characteristics with Mpumalanga and North West — mining and agri-industrial load, a dispersed commercial footprint, and a C&I sector slower to adopt despite adequate irradiance. The 65% adoption on the largest segment (43 rooftops) reflects a small cohort of early movers, not broad market movement. With 1.91 GW untapped, the opportunity is present but thinner and more dispersed than the provinces to the south.
Where the next large opportunity is
The headline figure is 29 GW untapped. The more useful question is where that capacity sits relative to how far each province has moved — and whether low adoption reflects a window or a structural explanation.
Two pools dominate. Gauteng holds 8.2 GW untapped at 12.4% adoption — the largest absolute pool in the country, in the densest industrial and commercial footprint. This isn't a province where low adoption signals an early market waiting to move; it's one where adoption already leads the country and the volume of unconverted rooftops is simply so large that the remaining opportunity stays enormous. KwaZulu-Natal holds the second-largest pool: 4.9 GW at only 6.5% adoption. That combination — a large, growing rooftop base, below-average adoption, a diversified commercial economy, and direct loadshedding exposure — is the signature of a province about to broaden. The top segment is at 32%, the curve is still early, and the Durban industrial corridor is dense enough to sustain systematic outbound work.
Western Cape (4.4 GW, 11.2%) and Mpumalanga (2.47 GW, 5.6%) sit in the next tier. The Cape is the most competed market in the country, but 4.4 GW of capacity remains and the broadening into mid-range rooftops is well underway. Mpumalanga is a different case: its large industrial base has been slow to adopt, and as grid reliability continues to deteriorate, the shift in load economics makes it a timing opportunity rather than a structural gap.
The contrast is Northern Cape: excellent irradiance, below-average adoption, but a very thin rooftop base. That pattern — good sun, low density — is structural. It will keep developing slowly regardless of the incentive environment. For an operator making allocation decisions, that distinction — a dense province with low adoption versus a sparse one with low adoption — is what separates a window from a longer, harder road.
What's driving adoption
The structural driver of South African C&I solar adoption isn't incentives — it's grid unreliability. Loadshedding, which peaked at Stage 6 in 2023 and remains a persistent operating reality, transformed the commercial calculus: operators installed solar to keep their facilities running. That demand-pull dynamic explains why adoption advanced before a mature regulatory framework was in place, and why the market has a depth and geographic spread unusual for this stage of the curve.
The economic case is now compounding on top of that structural driver. South Africa's commercial electricity tariffs have risen materially over recent years — Eskom's increases have consistently outpaced inflation — making the self-consumption payback on C&I rooftop solar increasingly straightforward at most building sizes. The Section 12B tax incentive provides additional impetus for corporates with tax appetite. The result is a market pushed by reliability concerns, pulled by economics, and increasingly supported by policy — three drivers that rarely align this cleanly.
Key takeaways
- South Africa has 36.6 GW of C&I rooftop solar potential across 224,000 rooftops; at 8.6% national adoption, 29 GW remains untapped — a broadening market, not a mature one.
- The national adoption curve runs from 3% on the smallest rooftops to 42% on the largest — the takeoff shape now straightening as momentum shifts into the mid-range segments.
- Gauteng is the single largest opportunity pool: 8.2 GW untapped at 12.4% adoption, the highest adoption and the densest commercial rooftop footprint in the country.
- KwaZulu-Natal carries 4.9 GW untapped at only 6.5% adoption — the clearest early-broadening signal outside the established leaders of Gauteng and the Cape.
- Grid unreliability (loadshedding) pulled adoption forward before policy did; rising tariffs and the Section 12B tax incentive are now compounding that demand.
Methodology
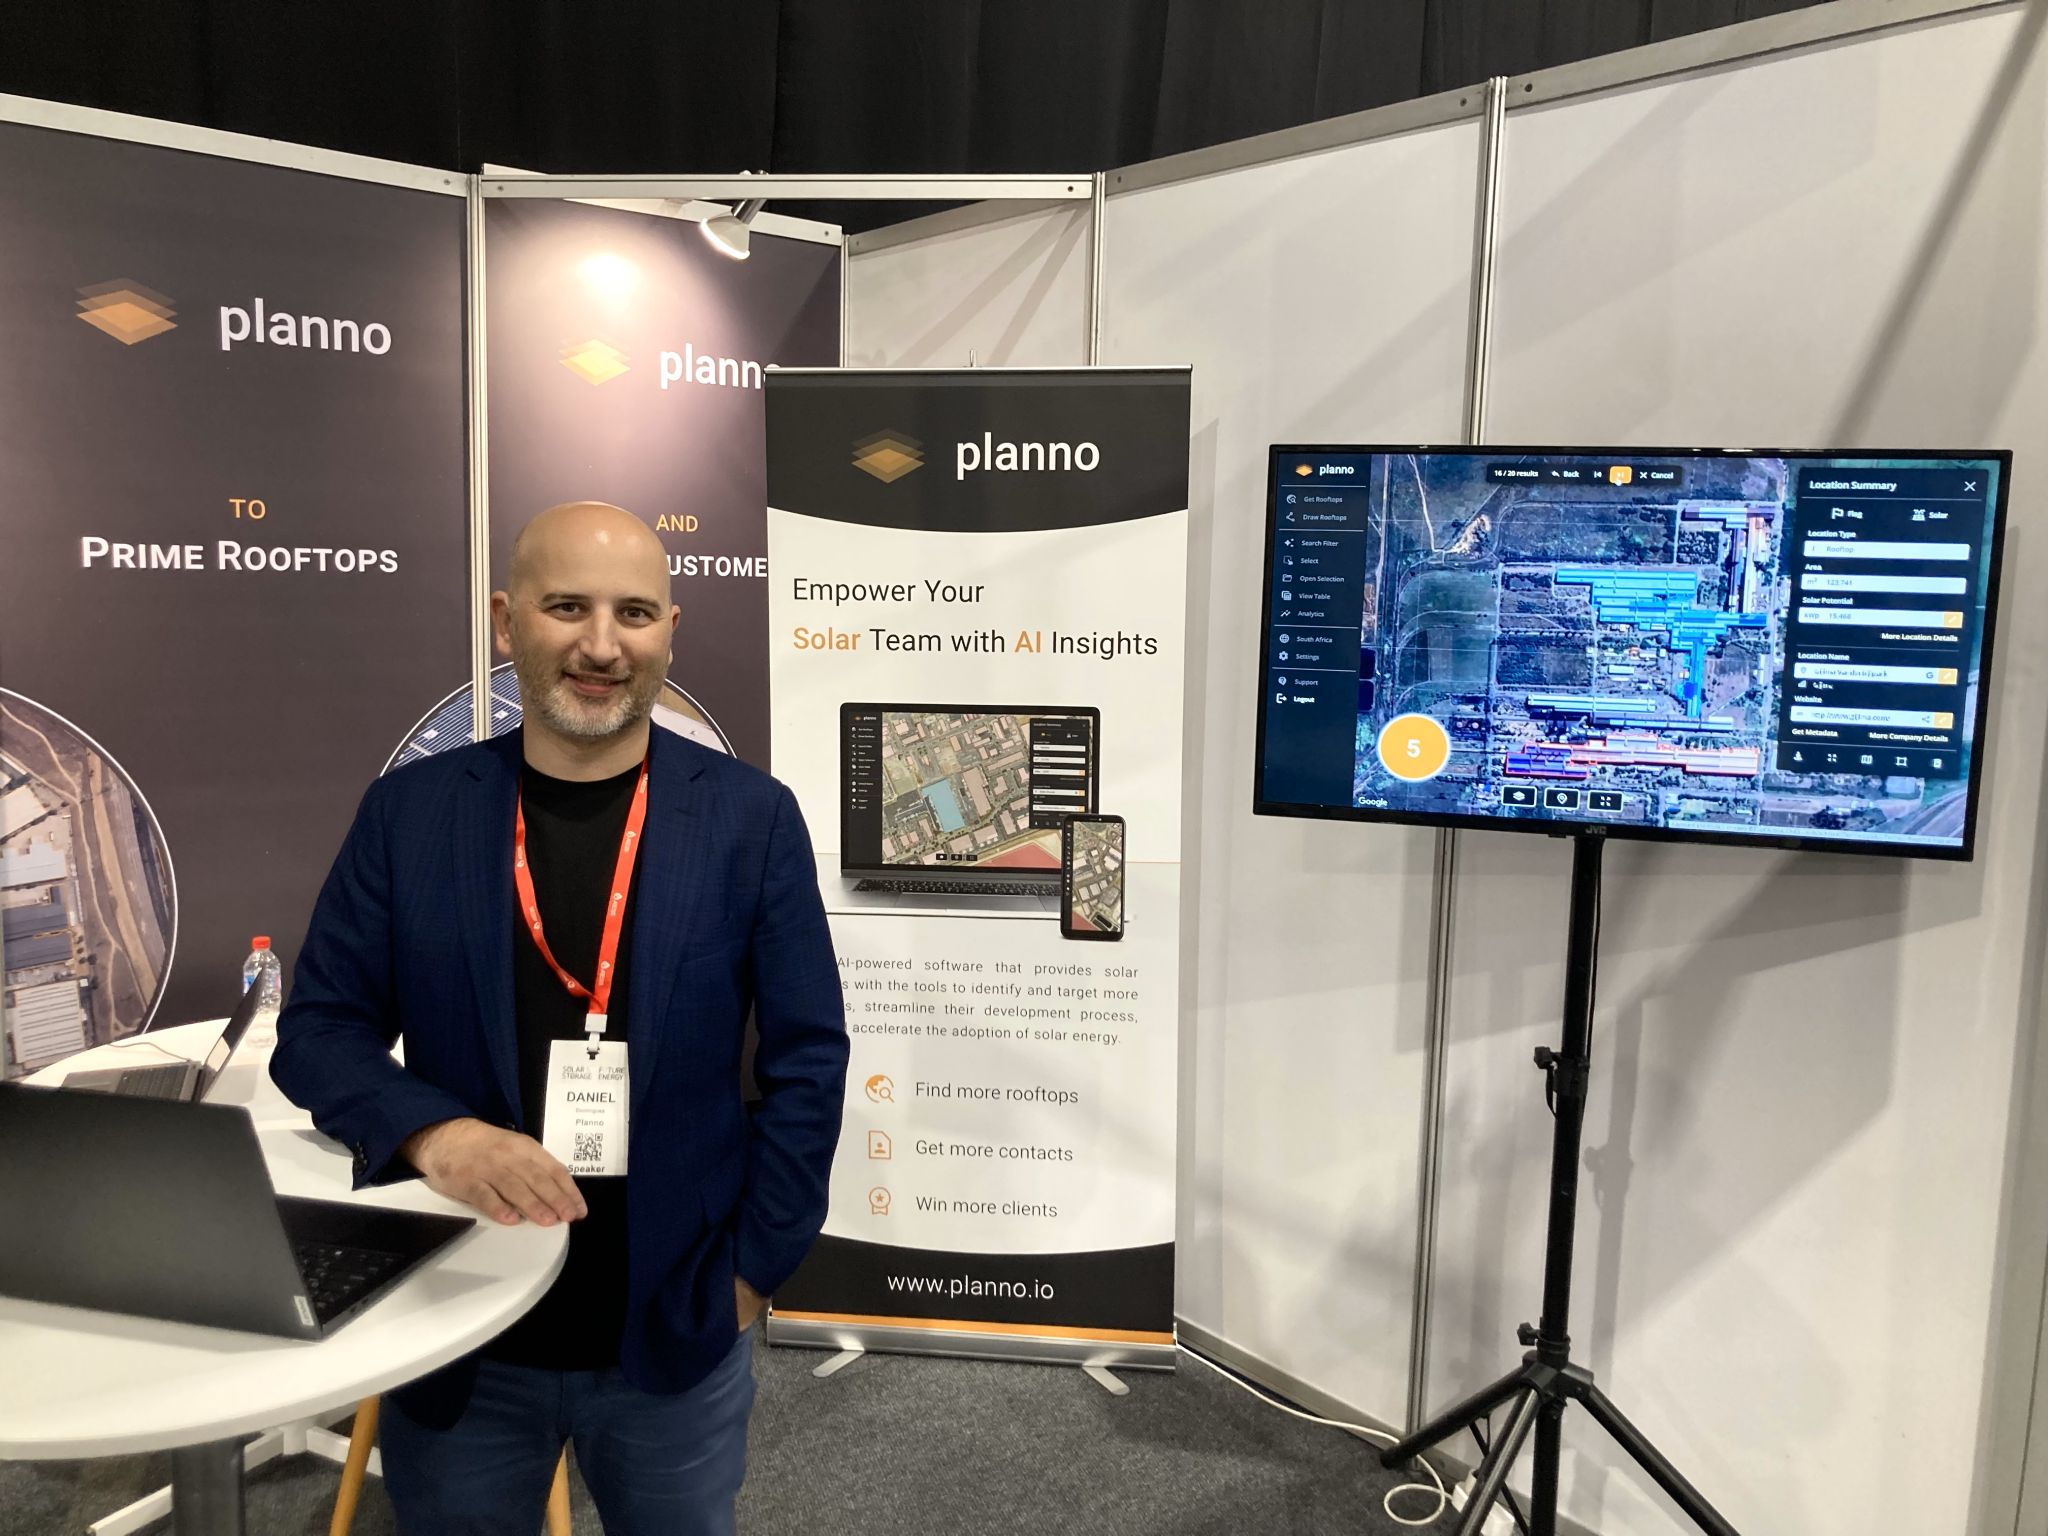
This breakdown comes from Planno’s national scan of commercial and industrial rooftops, fused with ownership, energy, and contact intelligence per building. The data was compiled in a recent scan. See how the platform works →
Frequently asked questions
How does Planno identify commercial rooftops?
Planno's geospatial AI scans high-resolution satellite imagery across the entire country and identifies every commercial and industrial rooftop above a minimum size threshold. The model is trained on real C&I assets and validated by solar developers.
How current is this data?
The most recent national scan was compiled in a recent scan. Figures are refreshed as new scans are run.
Where is the next large untapped opportunity in South Africa?
Gauteng holds the largest absolute untapped pool: 8.2 GW at 12.4% adoption across the country's densest commercial and industrial footprint. The sheer volume of unconverted rooftops makes it the primary focus for systematic outbound. KwaZulu-Natal is the most compelling early-broadening opportunity: 4.9 GW untapped at only 6.5% adoption, on a large and growing rooftop base with a diversified commercial economy and a curve that hasn't yet inflected. Western Cape (4.3 GW, 12.6%) remains active but increasingly competitive. The provinces to watch next are Mpumalanga and Free State — real capacity at below-average adoption, with load economics shifting in favour of adoption.
What's driving commercial solar adoption in South Africa right now?
Grid unreliability — loadshedding — is the primary driver: operators installed solar to keep facilities running before incentives were in place. Rising Eskom commercial tariffs have strengthened the self-consumption economic case, and the Section 12B accelerated depreciation allowance provides meaningful incentive for corporates with tax appetite. South Africa is unusual in having reliability, economics, and policy all supporting adoption simultaneously — the combination that drives a market from early-stage to broadening faster than any single factor alone.