Commercial Rooftop Solar Potential in New York City Metro
The NYC Metro region is one of the most energy-intensive and commercially dense markets in the world — yet the commercial rooftop solar potential in the NYC Metro area remains overwhelmingly untapped. Across New York City, Long Island and the surrounding counties, tens of thousands of commercial and industrial buildings sit in some of the highest electricity-cost territory in the United States, creating strong conditions for behind-the-meter solar adoption.
Planno analysed 64,641 commercial and industrial rooftops across the NYC Metro region, including the counties of New York, Queens, Kings, Richmond, Bronx, Nassau, Suffolk, Westchester, Rockland, Orange and Putnam. The data reveals a market with enormous volume, modest adoption and exceptional long-term rooftop potential.
64,641
Total C&I Rooftops
11 GW
Total Solar Potential
3.7%
Solar Adoption
Why the Commercial Rooftop Solar Potential in NYC Metro Area Matters
The NYC Metro area faces some of the highest commercial electricity prices in the country, pushing businesses to seek greater cost stability and energy resilience. With thousands of warehouses, industrial facilities, retail centres and mixed-use commercial buildings spread across the region, the area holds one of the deepest and most diverse rooftop landscapes in the United States — an ideal foundation for distributed solar.
State-level policy continues to accelerate this shift. New York’s long-standing commitment to clean energy, supported by agencies such as NYSERDA, has helped establish a strong incentive environment for commercial solar and community solar participation (NYSERDA). The regulatory direction is equally supportive: the New York Public Service Commission recognises distributed solar as a core component of the state’s clean-energy standard and grid-modernisation goals (NYPSC).
This regional momentum aligns with broader national trends. The U.S. Department of Energy continues to highlight how federal incentives under the Inflation Reduction Act are driving nationwide growth in commercial solar deployment (DOE Solar Overview). Industry reporting also reflects this trajectory, with PV Magazine tracking rapid expansion in corporate rooftop solar adoption across key U.S. markets (PV Magazine – Markets & Policy).
Together, high electricity costs, favourable policy conditions and dense commercial real estate make the commercial rooftop solar potential in the NYC Metro area not just significant — but strategically important for the region’s long-term energy resilience and decarbonisation.
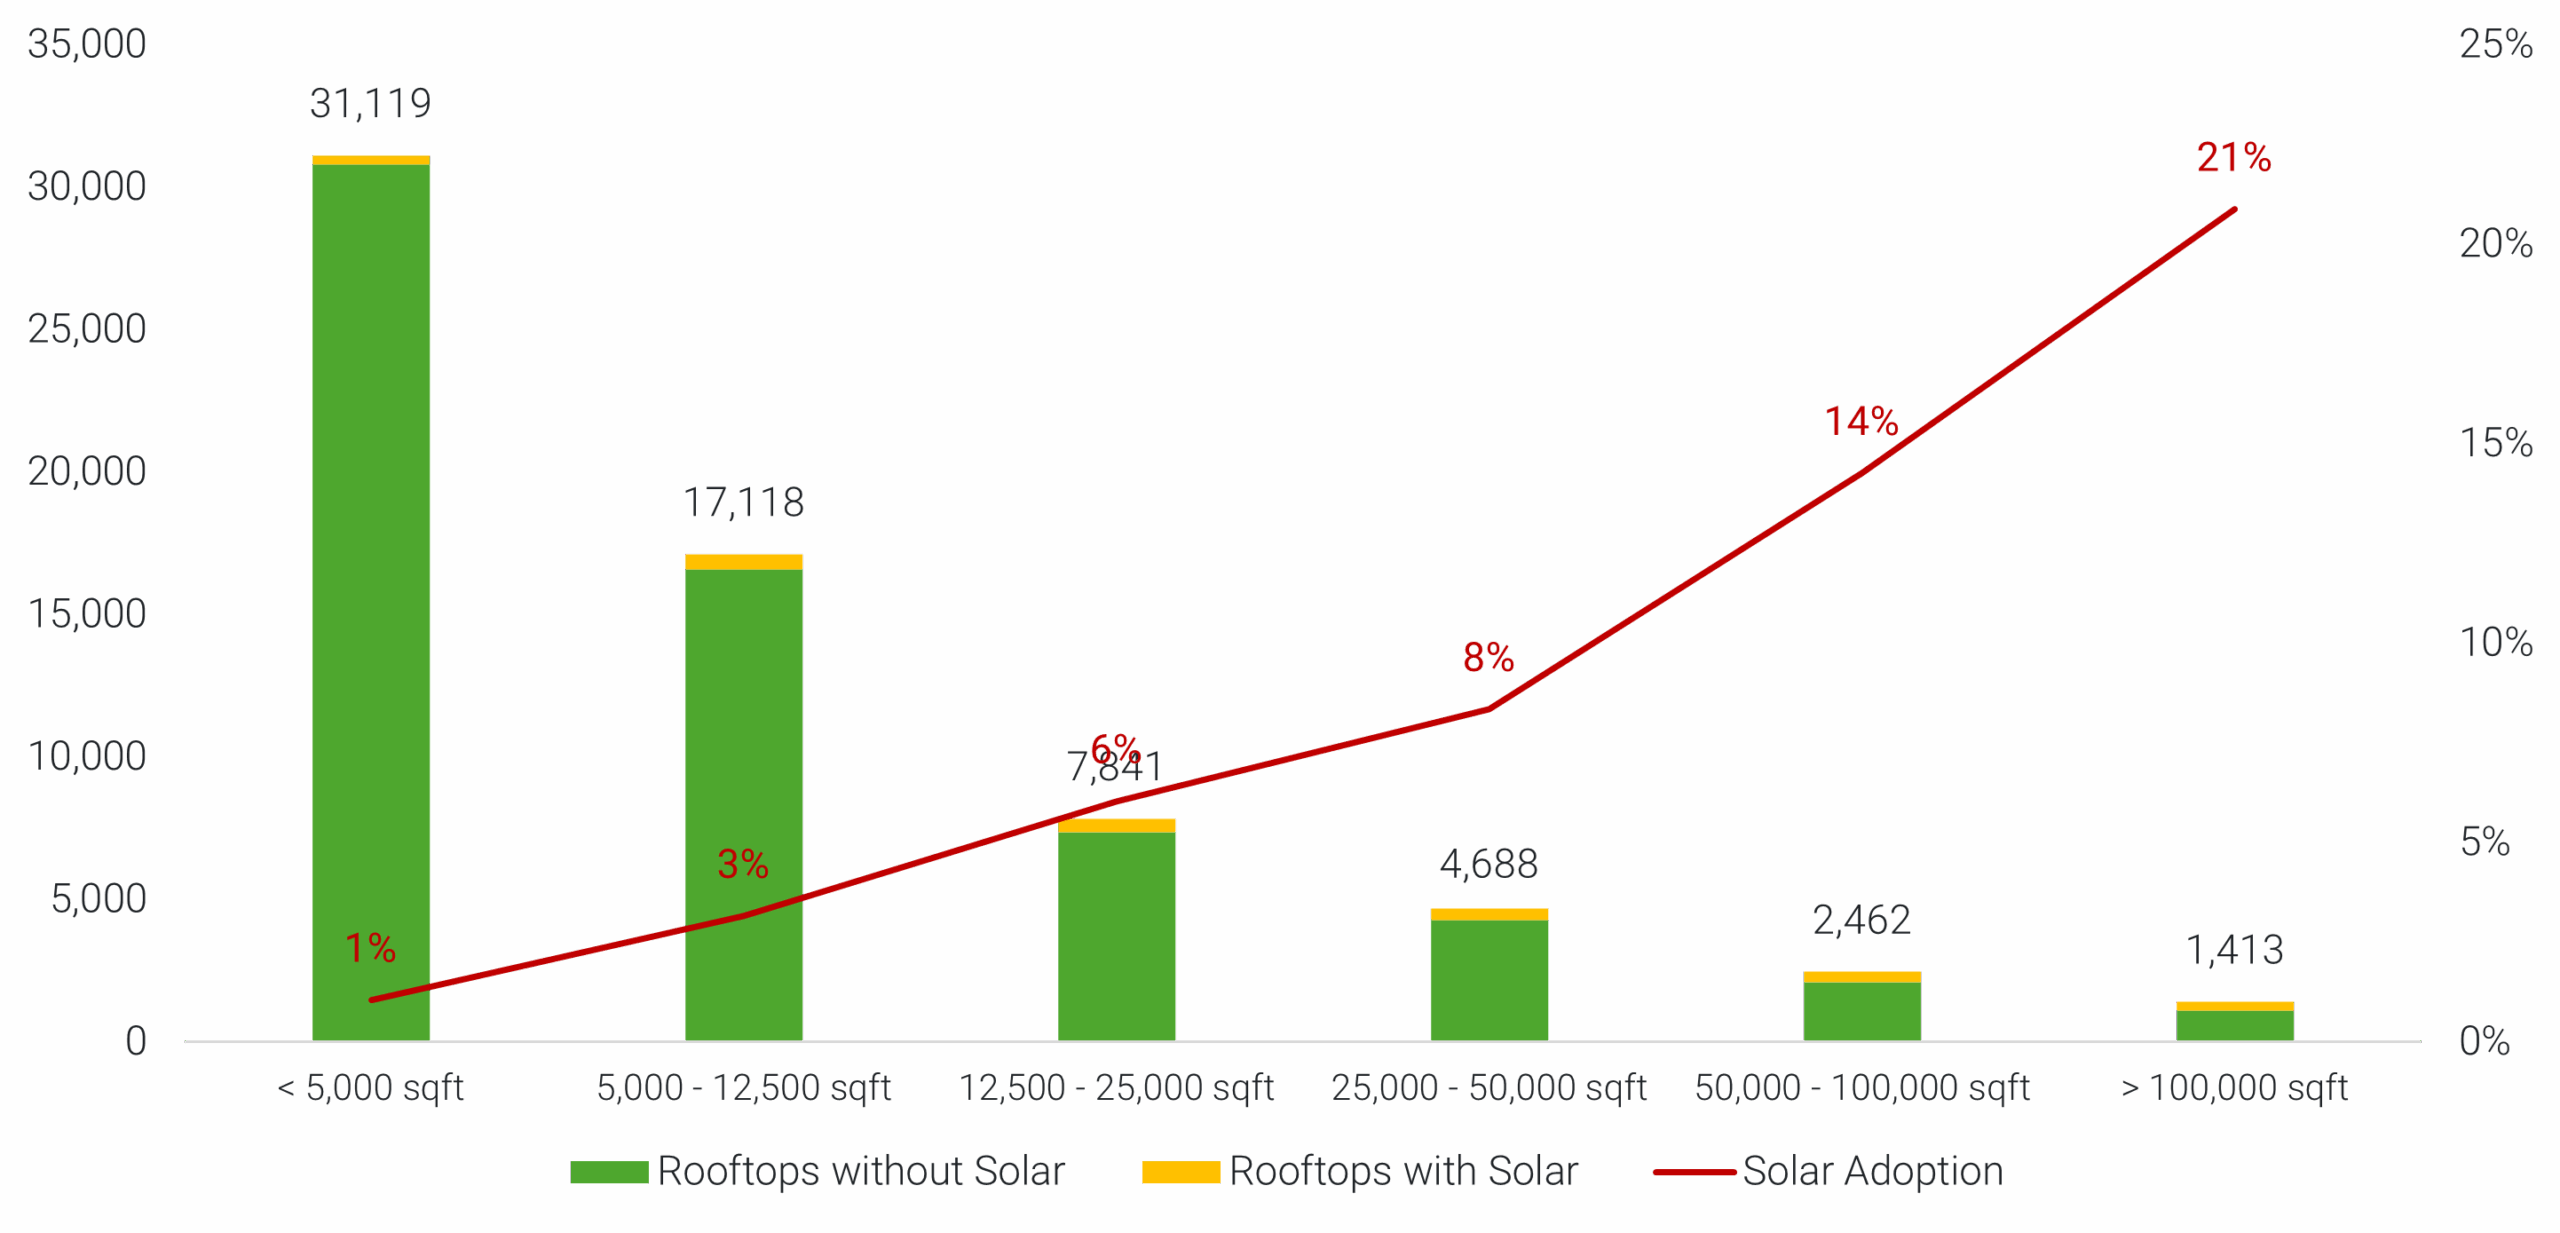
What the Rooftop Solar Data Reveals
The NYC Metro rooftop landscape is extremely diverse. Smaller rooftops (<12,500 sqft) make up the majority of the building stock, reflecting retail, mixed-use and commercial service buildings across New York City and surrounding suburbs. Adoption in these categories is very low, generally between 1–4%.
Mid-sized rooftops (12,500–50,000 sqft) — often retail anchors, light industrial buildings and distribution centres — show slightly higher adoption but significant remaining gaps.
The largest rooftops (>50,000 sqft), particularly those in Long Island, Westchester and Queens, represent the strongest solar opportunities. These include major distribution warehouses, manufacturing sites and airport-adjacent logistics nodes. Yet adoption even in these high-yield segments typically remains below 25%.
Across all counties, more than 9.8 GW of rooftop capacity remains unbuilt, making the NYC Metro area one of America’s largest untapped C&I solar landscapes.
Regional Breakdown: NYC metro’s Most Important Sub-Markets
Suffolk County
- 17,518 rooftops with 3.3 GW of potential
- 4.8% adoption
- Large warehouse and retail stock with strong daytime loads
- One of the region’s highest-capacity solar markets
📍 Nassau County
- 13,550 rooftops with 2.0 GW of potential
- 2.3% adoption
- Dense commercial corridors with strong mid-sized rooftop availability
- Major opportunity for multi-site commercial portfolios
📍 Queens County
- 6,812 rooftops with 1.2 GW of potential
- 3.4% adoption
- Urban industrial mix with limited land but abundant rooftops
- Excellent for mid-size C&I solar systems
📍 Westchester County
- 7,447 rooftops with 1.2 GW of potential
- 4.7% adoption
- High proportion of large commercial buildings
- Strong opportunity for institutional and logistics-driven solar
📍 Kings County (Brooklyn)
- 5,115 rooftops with 0.83 GW of potential
- 3.7% adoption
- Dense urban rooftops, many flat and solar-suitable
- Ideal for portfolio deployment across commercial districts
📍 Bronx County
- 3,216 rooftops with 0.52 GW of potential
- 4.4% adoption
- Large amount of underutilised commercial rooftop space
- Strong C&I solar opportunities across industrial corridors
📍 Orange County
- 4,744 rooftops with 1.0 GW of potential
- 2.2% adoption
- Growing logistics centres and warehousing
- High-yield opportunities with large rooftops
📍 Rockland County
- 2,480 rooftops with 0.52 GW of potential
- 1.7% adoption
- Mix of suburban commercial properties
- Strong potential in big-box and office rooftops
📍 Richmond County (Staten Island)
- 2,720 rooftops with 0.38 GW of potential
- 4.9% adoption
- Logistics and industrial zones with large rooftops
- High adoption growth potential
📍 Putnam County
- 690 rooftops with 0.13 GW of potential
- 4.6% adoption
- Smaller market with solid solar-ready stock
- Good fit for targeted C&I deployments
📍 New York County (Manhattan)
- 349 rooftops with 0.10 GW of potential
- 3.4% adoption
- Highly constrained rooftop space but strong commercial density
- Best suited to premium, high-value solar projects
What’s Changing: A Market in Motion
The NYC Metro C&I solar market is entering a major growth phase driven by:
- Escalating electricity prices, among the highest commercial rates in the U.S.
- Local Law 97, which increases pressure on building owners to reduce emissions across NYC
- Expanded state incentives, including NY-Sun and community solar programs through NYSERDA
- Federal IRA tax credits, which greatly improve project economics
- Growing corporate ESG commitments, especially among national retailers and logistics operators
Broader national trends underscore this shift. These combined forces are reshaping the commercial rooftop solar potential in the NYC Metro area, turning a historically slow-moving market into a rapidly expanding opportunity space.
Key Insights on Commercial Rooftop Solar Potential in North New Jersey
- The NYC Metro area holds 11 GW of commercial rooftop potential, with 9.8 GW still untapped.
- Adoption remains low (3.7%), even with strong incentives and high electricity prices.
- Long Island (Nassau & Suffolk) holds the largest volume of high-capacity rooftops.
- NYC boroughs offer dense mid-size rooftop opportunities ideal for portfolio deployment.
- State and federal policies are accelerating the shift toward large-scale C&I rooftop adoption.
How Planno Unlocks Rooftop Solar Opportunities
Planno makes this level of rooftop market intelligence actionable. Our platform uses geospatial AI to identify, size, and qualify rooftops for solar in every region — so you don’t have to guess where to go next. We also help you contact building owners and managers directly, turning intelligence into leads.
🚀 Want to explore the commercial rooftops solar potential in New Jersey?
FAQ
How much commercial rooftop solar potential does the NYC Metro area have?
The NYC Metro area has 11 GW of commercial rooftop solar potential, with 9.8 GW still untapped.
Which counties show the strongest rooftop solar opportunity?
Suffolk, Nassau, Queens and Westchester offer the largest high-capacity rooftop clusters.
How can I find qualified leads in the NYC Metro area?
Planno helps solar companies identify, pre-qualify, and contact rooftop owners using AI and satellite data.